Sine Wave Basics and Superposition
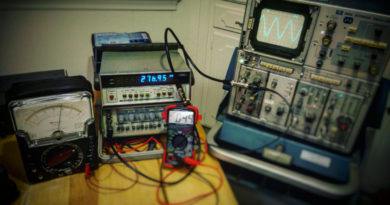
Sine waves are a very critical part of Lionel trains. Both the ECU-1 and Lionel transformers send out sine waves on their terminals. We should be able to view these wave forms on the oscilloscope and make the appropriate measurements.
y(t) = A sin( 2πft + φ ) generic sine wave equation
Sine waves with respect to time have 3 critical parameters: amplitude (A), frequency (f), and phase (φ). For this discussion, we will not need to understand the phase (φ) parameter. In terms of the oscilloscope, the sine waves we discuss will be voltage waveforms:
V(t) = Vpeak sin( 2πft ) AC voltage sine wave formula excluding phase (φ)
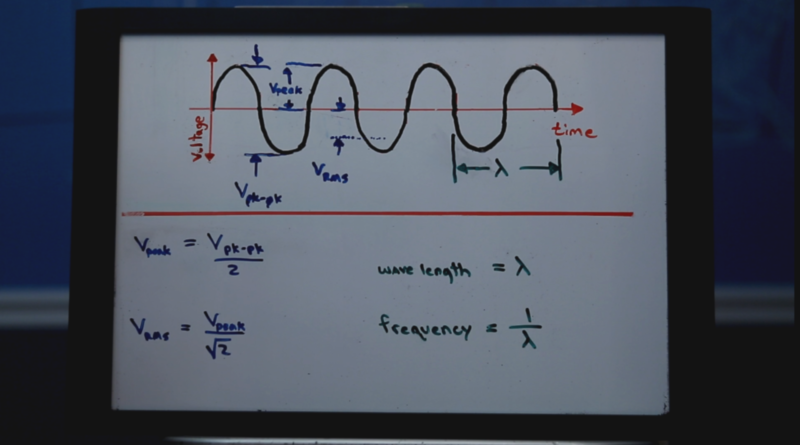
The amplitude of an AC signal is generally described one of 3 ways: the peak-to-peak amplitude, the peak amplitude, or the R.M.S. amplitude or root-mean-square amplitude.
For most of our discussions (in the ECU-1 introduction), we will be referring to the RMS amplitude. The relationship between all 3 amplitude descriptions (in terms of voltage, V) is as follows:
The peak to peak voltage, Vpk-pk, amplitude is the voltage from one crest of the sine wave to the proceeding trough.
Vpeak amplitude is then one half the peak to peak voltage, or
Vpeak = 1/2 * Vpk-pk
And finally the VRMS amplitude is the peak voltage divided by the square root of 2, or
VRMS = Vpeak / √2
The frequency, f, of the sine wave is how many times the sine wave oscillates in a single second. Since oscilloscopes generally can not measure frequency directly, one usually measures the wave length (which goes by the Greek letter lamda, λ). The wave length, λ, is the time it takes for a single oscillation of the sine wave to occur. The relationship between each is as follows:
f = 1 / λ
Frequency is given in units of Hertz, Hz. And wavelength, λ, is given in units of seconds, s.
Examples:
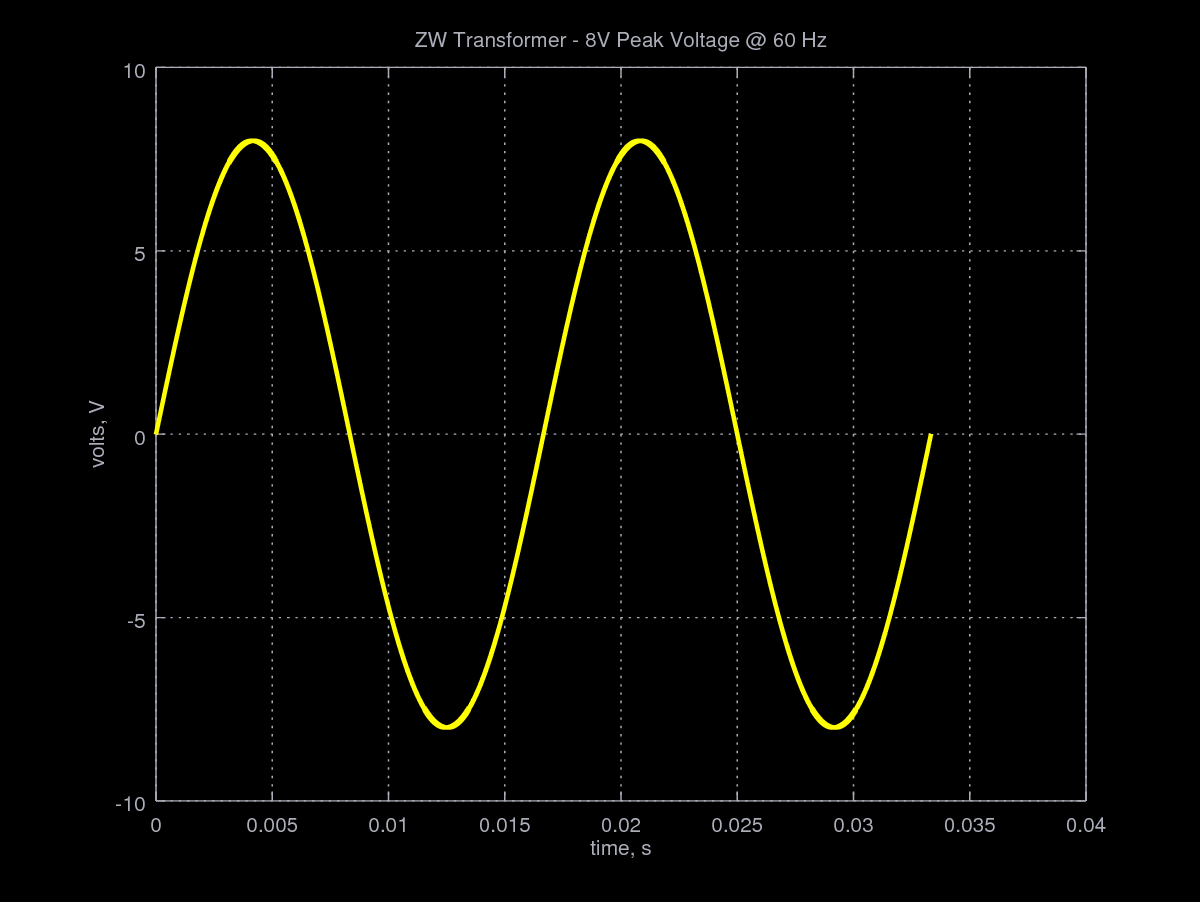
60 Hz sine wave having a peak voltage of 8V.
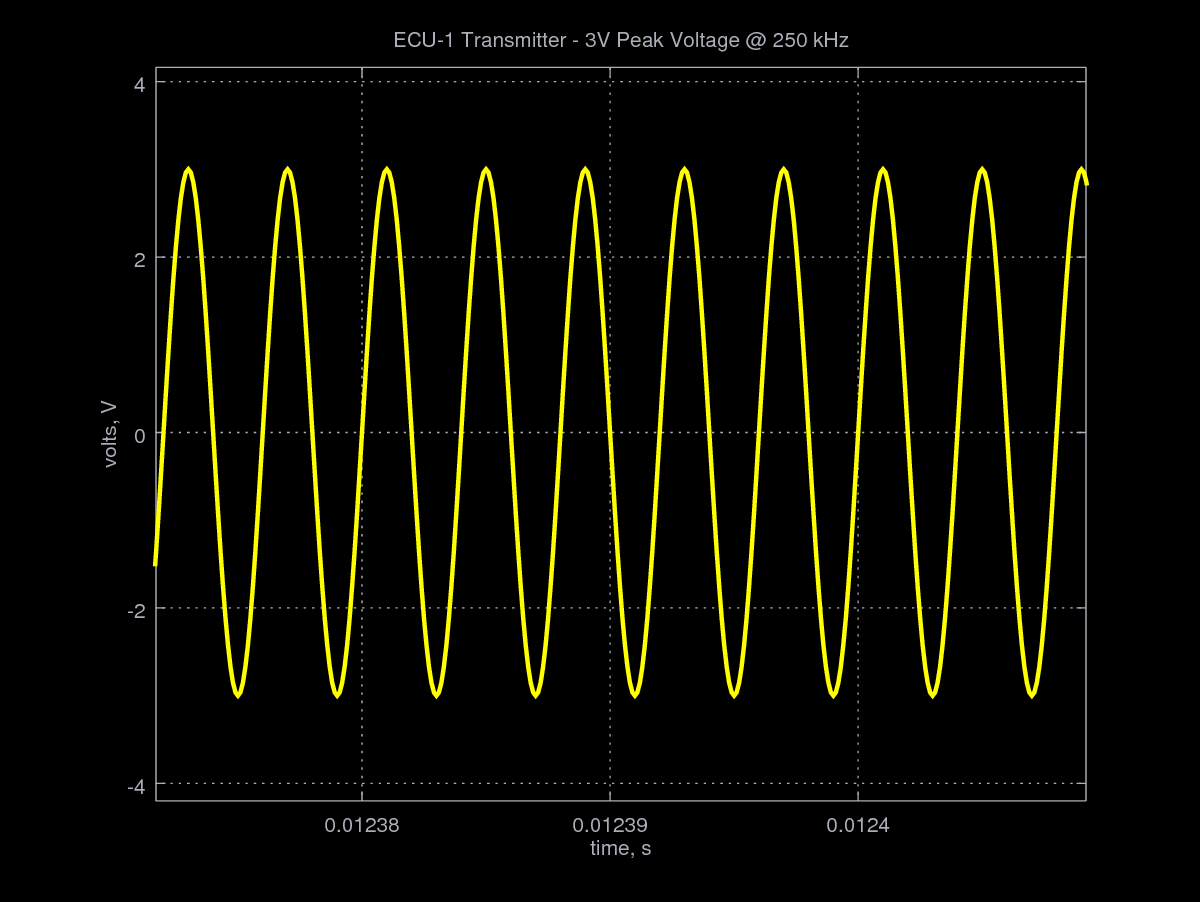
250 kHz sine wave having a peak voltage of 3V.
Superposition is simply the mathematical addition of two wave forms. For the Lionel Electronic Set, the ECU-1 transmitter superimposes a low voltage, high frequency signal (3V at 200kHz to 400kHz) onto the high voltage, low frequency track power signal (8V to 20V at 60 Hz).
Examples:
60 Hz, 8V peak sine wave and a 250 kHz, 3V peak sine wave displayed individually on the same graph.
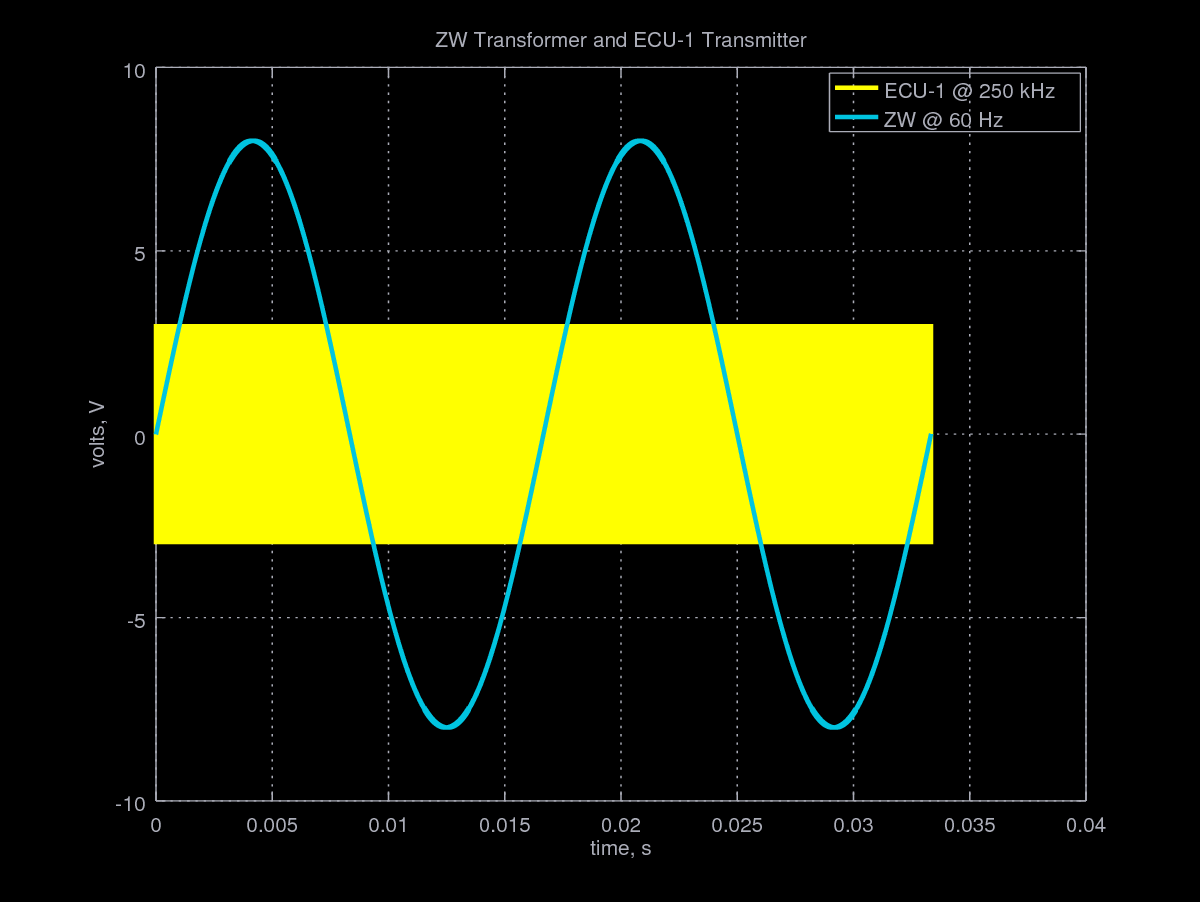
60 Hz, 8V peak sine with a 250 kHz, 3V peak sine wave superimposed with each other.
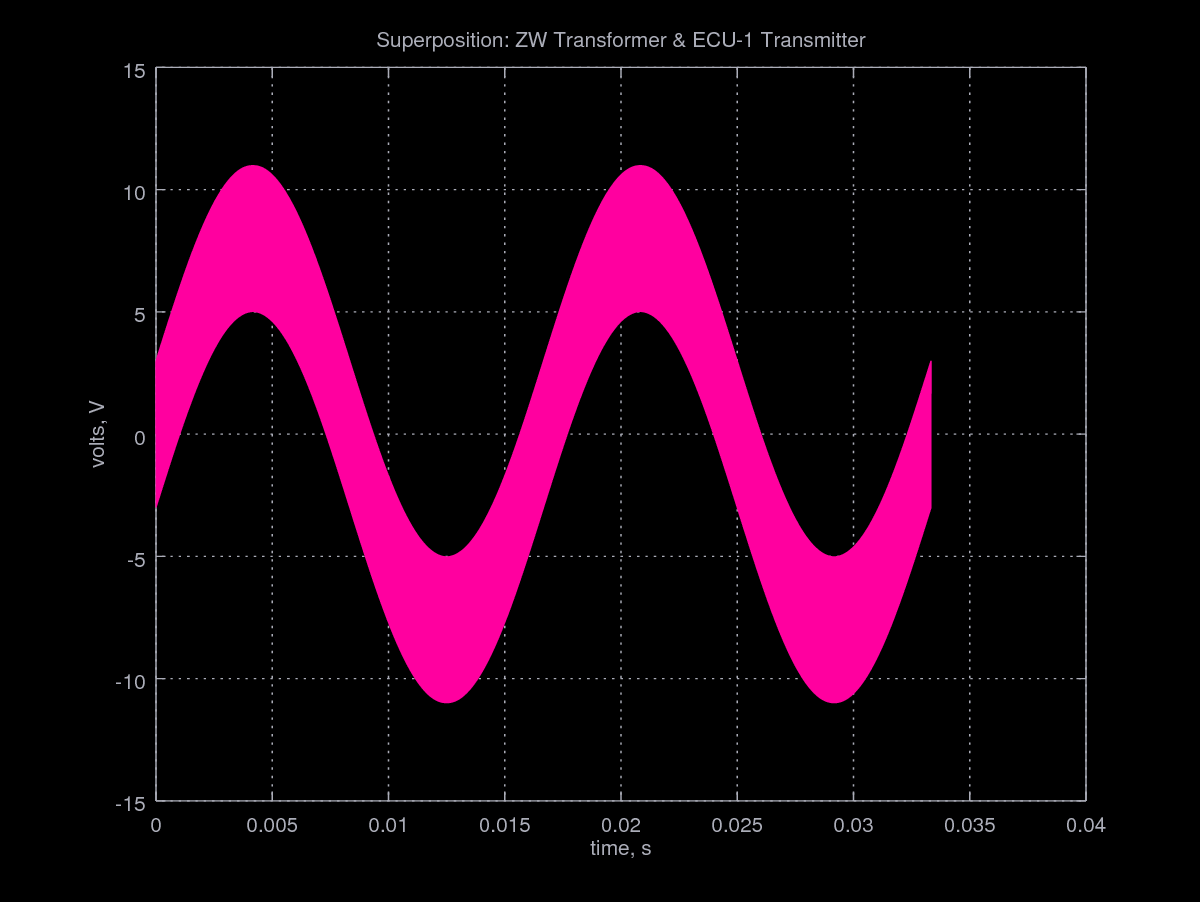
The software that I am using for the examples and plots is Octave. Octave is very similar to Matlab by the company Mathworks but does not require a license.
